How a classic statistical technique can improve your fantasy football team and the lessons for forecasting marketing campaigns…
Forecasting Sports
It is August and Premier League football returns this weekend. If you are working on your fantasy football team and are looking for statistics to help, then you could do worse than using the James-Stein Estimator.
The James-Stein Estimator was developed in the late 1950s and early 1960s by two mathematicians: Charles Stein and Willard James. The most famous application of the estimator was predicting the batting averages of baseball players in the upcoming season by using the batting averages from the previous season.
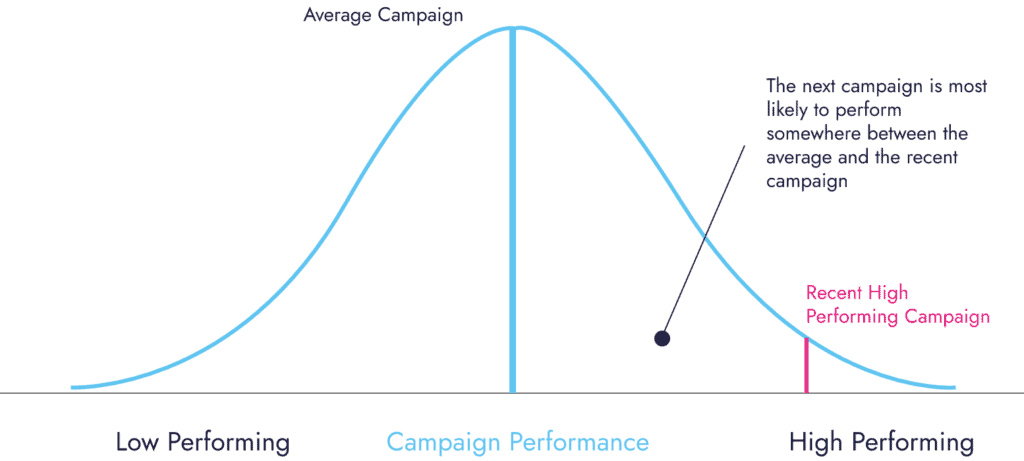
They constructed a formula that combined both that player’s batting average last season, with the batting average of all players. The forecast sits between the player’s personal average and the group average.[1]

What the estimator says is that players who previously performed above average are likely to do so again. But they’re more likely to gravitate back to the league’s average this season. So going back to Premier League football, a player like Manchester City’s Erling Haaland, who had a record-breaking debut last year, is likely to perform strongly again. But it is likely (though not guaranteed) that he will drop off slightly this year.
Likewise, players who performed below average last year are likely to do so again, but the chances are they’ll get closer to the average performances.
Applying to Marketing
If a player has an exceptional season it will be partly down to their hard-work and talent. But it will also be due to other factors landing in their favour that year: e.g. staying injury-free, playing in a system that suits them, their competitors not adapting to their strengths etc… It is unlikely that all these conditions will continue indefinitely.
There are parallels to sports when it comes to marketing. If a campaign performs strongly, it will be down to multiple marketing elements all coming together: a clear brief from the marketing team, which translates into a strong creative and is executed immaculately by the relevant media agencies.
But if just one of those elements is slightly weaker on your next campaign then you should expect lower results. Conversely, if your campaign performed below average, it is likely that there are things you can easily improve on your next campaign.
Marketing Effectiveness Practitioners are often called on to forecast or optimise upcoming marketing campaigns. We tend to use the latest results available – whether that’s econometrics / market-mix modelling (MMM) or incrementality tests. And it’s understandable why – this is the latest, most relevant information we have.
We only rely on average benchmarks from other brands when we have gaps – e.g. the brand in question is trialling a marketing channel they have never used before in their upcoming campaign.
But is this the most robust approach? The James-Stein method would suggest we should also consider peer-group benchmarks, as campaigns will gravitate towards these averages.

Admittedly, this is easier said than done. Most of us believe (or at least hope) to be better than average at our professions – when by definition this is impossible. So accepting that our next marketing campaign could drift down towards the average means swallowing our pride.
But in the long-run being aware of this risk will result in better-budgeted campaigns, more credibility with other stakeholders like finance and being able to quickly recognise when we are onto a successful campaign.
In Summary
If you’re a Marketing Effectiveness Expert then I’m not suggesting that you abandon your current way of running a forecast or an optimisation. But consider running an alternate-version based on your benchmark response curves – calibrated to the size and sector of the brand in question. If you get similar results, then this can give you additional confidence in your recommendations. If not, then this could provide some additional guidance on potential risks or up-sides.
If you are a marketer receiving a forecast or optimisation from a Marketing Effectiveness Practitioner, then ask how is it being generated: from the latest results, from benchmarks or a blend of both? Perhaps ask for a version based on average benchmarks. You might be surprised to see how well your campaigns are currently performing if they are above average. If not, it gives you something to aspire to.
Further Reading
This paper provides a good balance between the mathematics behind the James-Stein estimator and its application.
Efron, B.; Morris, C. (1977), “Stein’s paradox in statistics”, Scientific American, 236 https://efron.ckirby.su.domains/other/Article1977.pdf
Paul Dyson’s research still leads the way in disentangling all the elements of campaign success. The 2023 (and latest) iteration of his work can be found here:
https://www.warc.com/content/feed/creative-is-biggest-profitability-lever-brand-size-top-factor/8292
In terms of ‘right-sizing’ benchmarks to particular brands, then the ARC databank is a good place to start.
https://ipa.co.uk/media/10988/arc21-report-to-accompany-effworks-v2.pdf
[1] Whether the forecast is closer to the player’s average or the group average will depend on statistical properties relating to variance in the overall dataset. I won’t cover these here but you can find out more in the suggested further reading.
